
Intro
Grafana was originally created by a single developer because he felt that he could improve Kibana, a visualization framework which comes bundled with Elasticsearch. Over time, it has been co-opted by other ecosystems like Prometheus, Influx, etc. as one the standard ways of visualization as well, allowing Grafana to become one of the industry standards in the field of observability and visualization of data.
At VIMANA, we use Grafana dashboards extensively for system observability. This includes both the telemetry data (about the operations infrastructure), as well as the device data (from the sensors). The data in the backend is hosted in Elasticsearch, and Grafana makes queries to Elasticsearch to render the visualizations.
Grafana dashboards are very intuitive to build (except the landing page which I can never make sense of!). However, we have observed over time that even a single, unoptimized dashboard can end up causing a huge load on the Elasticsearch cluster. A small number of users simultaneously querying Elasticsearch via one of these dashboards can cause the CPU usage to spike causing a potential lack of data availability and reducing Elasticsearch indexing speeds, cluttering up the downstream pipeline. This document explains a few things we have learned while trying to improve Grafana dashboards.
How to profile your Grafana query
Panel Inspector
Grafana comes packaged with with a Panel Inspector Tool that allows you to:
- View the request being made to the server
- View the response from the server
- Get statistics on query response times
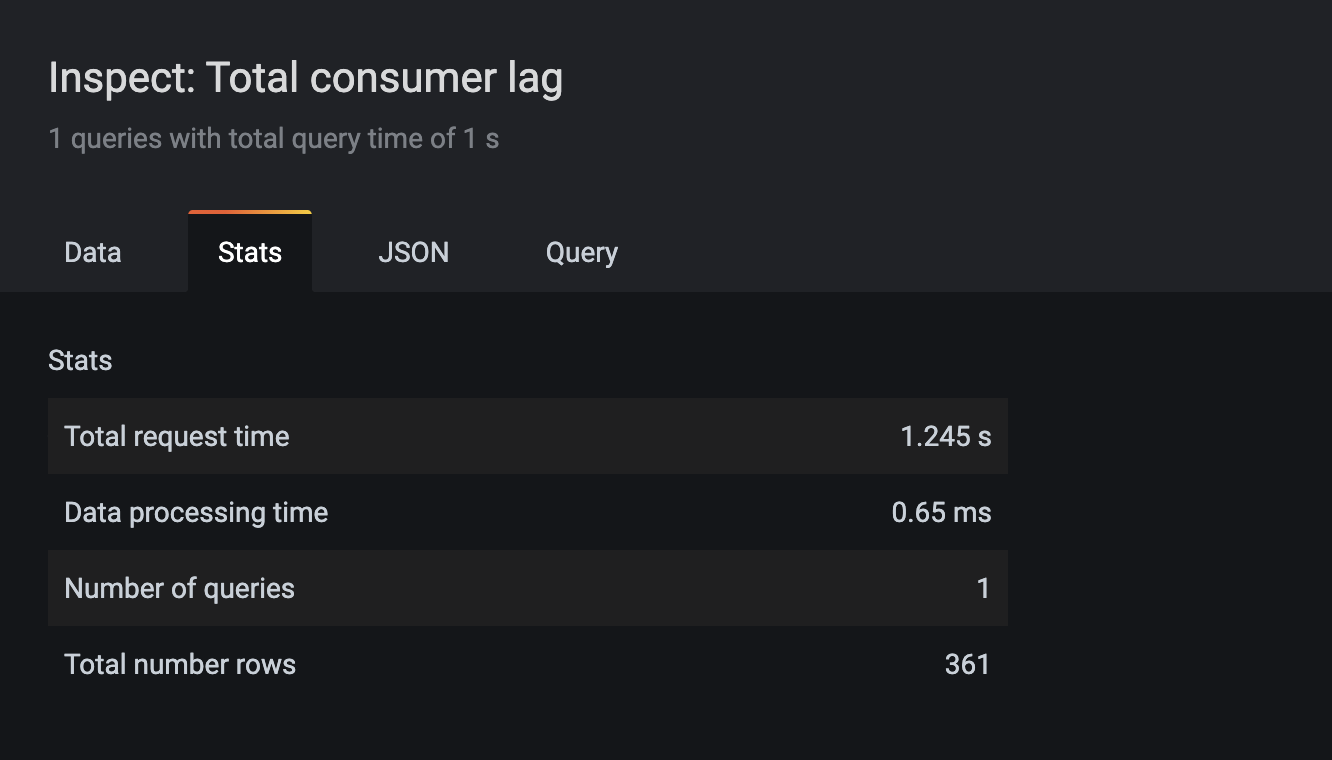
This is a good place to start your profiling as it tells us what is the exact query that is being sent to Elasticsearch. In many cases, getting an understanding of the actual queries being made, helps us understand where the bottlenecks are.
Using Browser DevTools
The panel inspector allows you to debug individual panels in Grafana quite well. However, in cases where there are dashboards with many panels, you might be interested in knowing the interactions between the queries being made by the different panels and the multiple Elasticsearch requests sent from the dashboard. In this case, we have found that it is best to use the developer tools from the browser to get a holistic view of the dashboard.
Browser usually have a Developer Tools option that can help in all sorts of debugging. Developer tools have a lot of information, but in this specific case, we’re interested in the Network tab which shows what are all the queries that are made by the browser, including those to the backend.
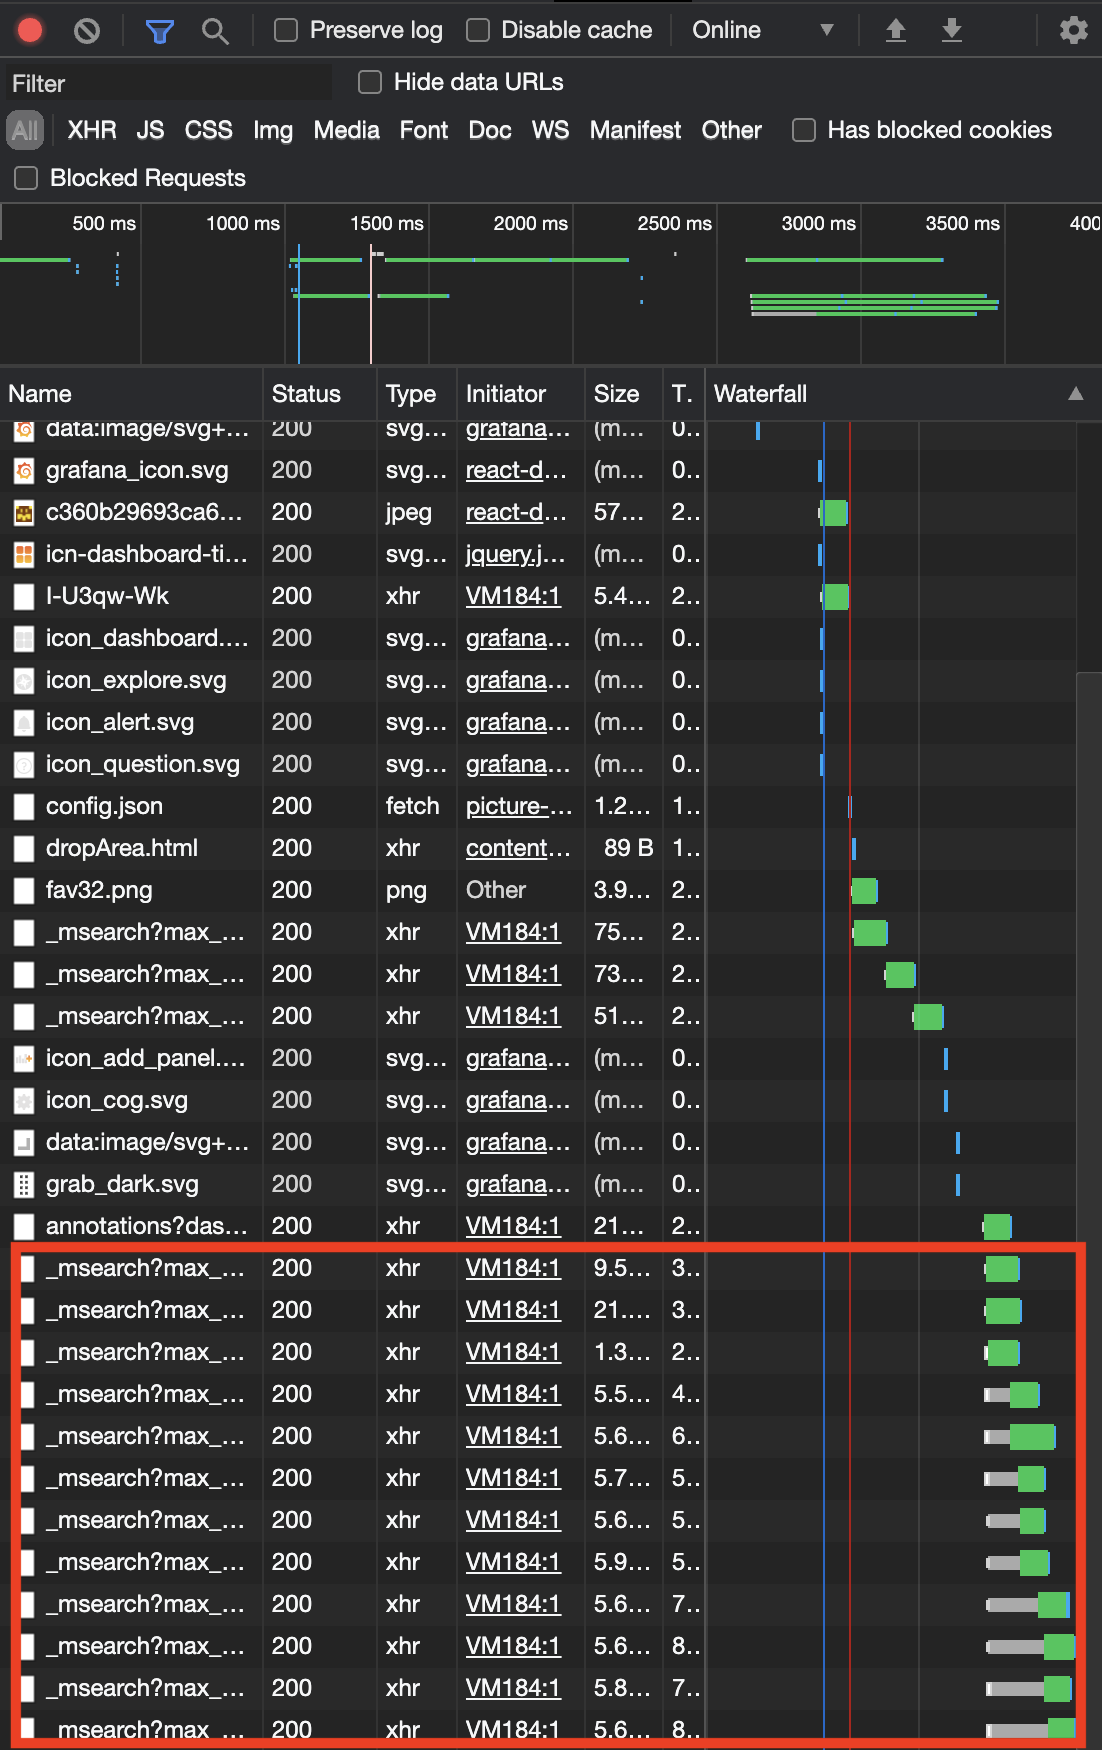
Grafana queries to ES are sent to the _msearch endpoint which you can filter using the search box, to see all the queries made by a single dashboard load. For each query, we can also see the time taken by the request along with the query details, payload etc which can be accessed by going into the details page of the individual queries.
Using Logs from Elasticsearch
If you have query logging enabled in ES, we can also see the same queries from the Elasticsearch side of things by going over the query logs. This can be either by accessing the container logs directly, or more likely, by persisting these in a logging system (like an ELK stack) and looking at the logs as a whole. This is also the most efficient way to get summary statistics of the queries. There are two kinds of queries in this case that you might be interested in
- Dashboard logs for each page load request from a Grafana dashboard
- Logs for each individual query made
Using Elasticsearch Dev Tools
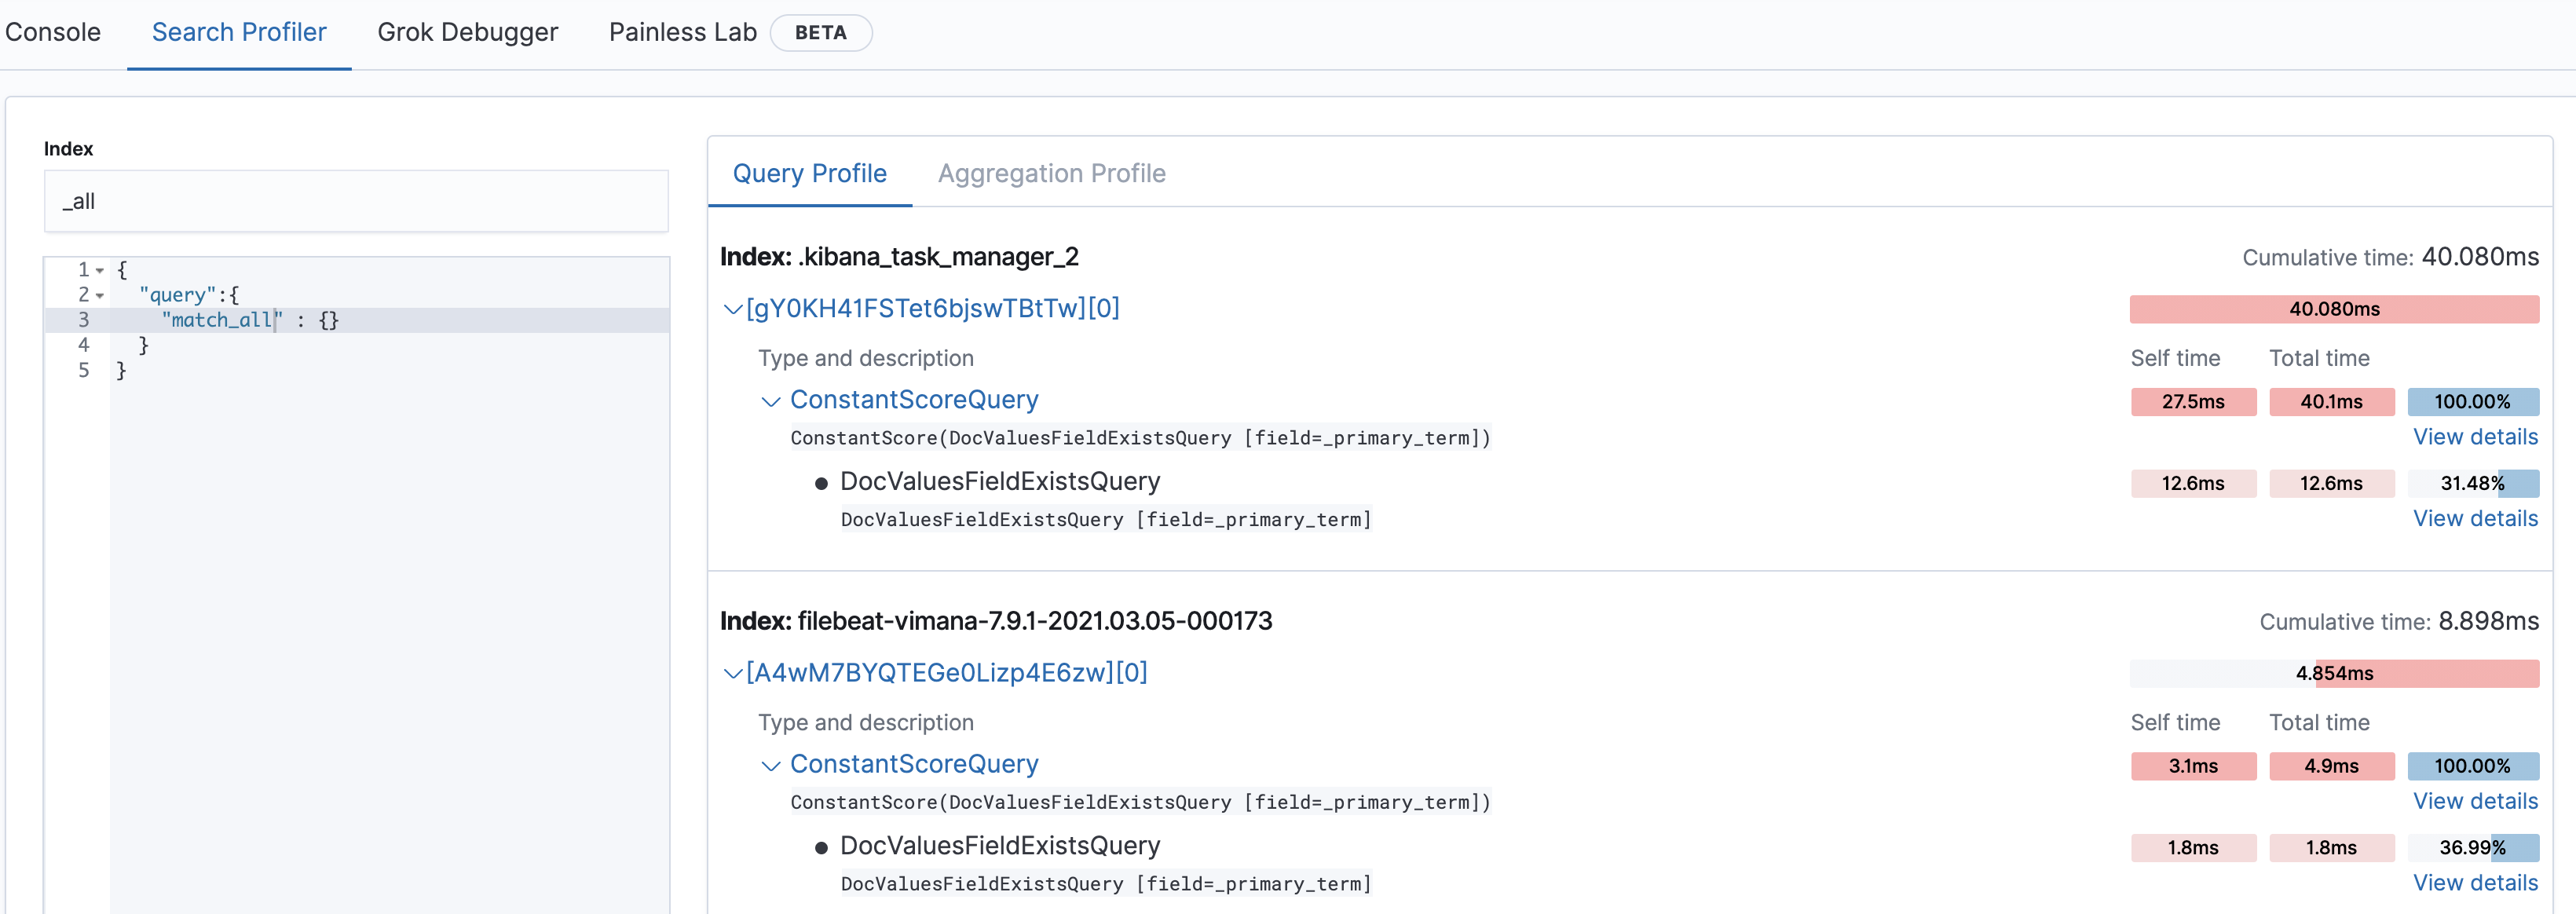
Once you have identified the queries that you want to profile using the above techniques, we have to figure out if those queries can be optimized further and if so, how. Sometimes it might be obvious why the queries are slow, but in other cases, you might want to understand what Elasticsearch is doing in the background for it to take so much time. Kibana has a Dev Tools tab which has a search profiler which can help you debug how a single query are executed.
Observations and Recommendations
‘Now’ Queries are not Cached
By default, Grafana dashboards are tranched by time into executing the query for the last few hours, minutes, etc. These queries are parsed by Grafana to find the current time and sent to the Elasticsearch as absolute time range queries. However, one issue with the default now queries is that the time range of each query is different.
Elasticsearch natively implements query caching which can quickly return results that have been executed previously without stressing the cluster. However, the cache is hit only when the queried time range exactly matches a previously queried time. Because of this behavior, the user doesn’t get any benefit of using the Elasticsearch cache while doing very similar repeated queries.
Recommendations
- Query using absolute times in the dashboard if the the time range you’re looking for is in the past.
- If relative times are necessary, use the
/notation (now - 1d/d,now - 2h/h) etc to tranch the time range to fixed boundaries

Use tranched absolute times rather than now queries
Time aggregations can become expensive
We’ve seen two cases in which aggregations based on time where the query can become really expensive -
- Date histogram with small buckets - This is a common case where the user is trying to zoom into individual data points, since Grafana only allows the user to view an aggregation and not necessarily the source data. However, the number of aggregation buckets can grow really large if the bucket size is small. For example, we have had users trying to look at last one day of data with a bucket size of 250ms. This comes to around 86400 * 4 buckets which can overload 1) the cluster, 2) network, 3) Grafana trying to render all these points.
- Term aggregations based on time - This is similar to the other case, but where the user tries to work around the situation of having small buckets by keeping each timestamp in individual buckets. While this can be alright if the number of timestamps is less, in many cases the sampling rate of the data is very high and we could end up with millions of data points in a few hours time range if we are not careful.
Recommendations
- Let Grafana manage the bucket size (default behavior)
- Limit queries across smaller time ranges if you’re looking for very granular data
- Do not use terms queries for fields with large cardinality like time ranges

Using Interval: auto allows Grafana to manage the bucket size smartly
A Single Dashboard can make 100s of queries
In many cases, people creating the dashboard like to have all the information they want in one screen. While this might work for dashboards having less data, with more data/aggregation-heavy dashboards, this can mean that each dashboard is sending 100s of queries in one shot while it is getting loaded.
Recommendations
- Use
Group Byinstead of multiple queries - In many cases, you want to compare the behavior of multiple timelines which differ by a single field (say comparing multiple IoT devices) at the same time. In such a case, instead of having an independent query for each filter (Query 1 filtereddevice_1, Query 2 filtered bydevice_2), it is better to do a generic filter (filter bydevice_1 OR device_2…) and then add aGroup Byoption (before the mandatoryThen bytimestamp). - Use different dashboards for each use case rather than putting everything into one dashboard
- Use Rows to hide set of panels that are not always relevant (rows are loaded lazily by Grafana only upon expanding)
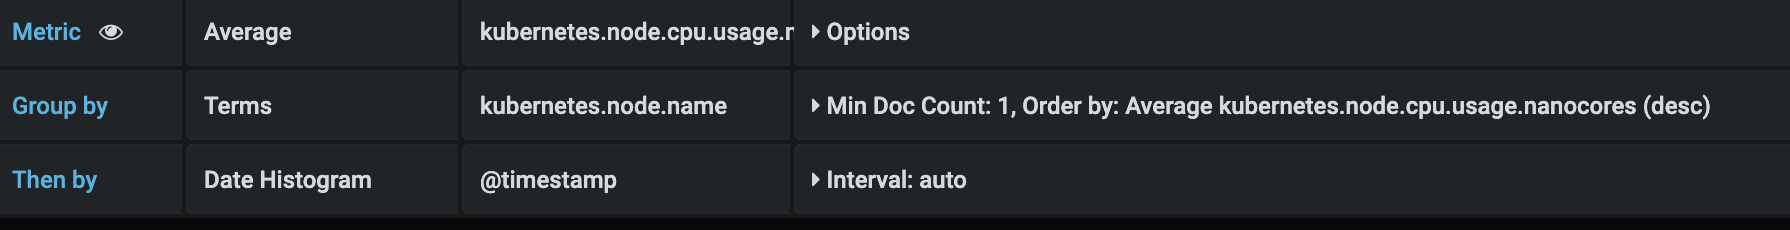
Group By terms, then by time
Queries hitting multiple shards can overload the system
If most of your aggregations are about a single dimension (a data item, a device etc), if the data about that dimension is stored across all the shards (default round robin routing behavior), then each query (even if for a single device) will be hitting all shards of all indices matching the index pattern of the cluster, which most likely will be dividedd across all the nodes. While this can potentially increase the querying speed, in many cases, this also involves bringing in data from all partitions into a single node for aggregation while also taxing all the nodes instead of isolating the load into a single node/shard. This can cause the cluster load to go up when many queries are being made at the same time.
Recommendations
- Route documents while storing the data so that each commonly queried dimension is stored in a single shard/node as much as possible.
Conclusion
The contents of this post have been created after a lot of experimentation and reading the excellent Elastic Documentation. We’ve been able to make an order of magnitude increase in querying efficiency following the above guidelines. However, it is possible that the suggestions don’t work as is for your system and data model and if so, please post a comment!
Credits
This work was done in collaboration with Malavika Krishnaswamy. Also thanks to VIMANA where I learned everything I know about Elasticsearch (and programming in general!)