
In my previous post, I shared my running journey and the frustrating 4-year plateau I couldn’t seem to break through. Despite consistent effort, my 10K pace improved by only 1 second per km over four years, from 2018 to 2022. Today, I want to explain how I got out of the rut.
Before I started structured training, my coach Rahul evaluated my running data and had a single piece of advice: I needed to stop following my “intuition” and follow a structured training plan based on exercise science. For natural runners, intuition guides them well into doing the right thing, but for someone like me who has struggled with running, following science would yield much better results.
The insights in this post aren’t revolutionary in scientific/running circles; exercise physiologists and pro runners have understood these principles for decades. But like many recreational runners, I had been stuck in what coaches call the “moderate intensity trap”. This is when you train too intensely on a day-to-day basis and hence don’t get enough recovery to condition the heart. But at the same time, you are not pushing hard enough to improve speed either.
We need to talk about heart rate zones before we move further.
Understanding Heart Rate Zones
Here is what any article about zone-based training will tell you about the different HR zones:
- Zone 1: Recovery – extremely easy effort that primarily promotes blood flow and active recovery. The heart is not really stressed in this zone. You can stay in this zone indefinitely.
- Zone 2: Base building – this is the foundation of any training. In this zone you are pushing the heart, but at a sustainable rate. Most training should happen here. You can have an easy conversation in this zone (hence it is also called the conversational zone).
- Zone 3: Aerobic power – your body gets enough air that you don’t start panting, but you do slowly accumulate fatigue in this zone.
- Zone 4: Lactate threshold – the body can just about get enough oxygen to sustain this output, but you start panting as it tries to get even more. It also cannot sustainably clear lactate/hydrogen ion accumulation in this zone, which causes muscle fatigue. Recovery needs are high.
- Zone 5: Anaerobic capacity – short bursts that maximize power. Every minute in this zone requires a lot of recovery time before the body can start improving.
Note
Generally, people quote numbers like "50–60% of max HR is Zone 1" as if they are canon, but in my experience those percentages are only a starting point when doing zone training. They differ from runner to runner, and you need to find your own zones over time. There are different ways to do it, with a lactate threshold test being the gold standard. However, you can get reasonable accuracy by using some rules of thumb.
Looking back at my heart rate data from 2016–2022, I realized nearly all my runs were in Zones 3 and 4. A lot of running coaches call this range the “grey zone” or “dead zone” because it is “neither here nor there” – stuck between proper aerobic development (Zone 2) and high-intensity intervals (Zone 5).
You Learn Endurance Through Zone 2
When my coach first created a 16-week training plan for me, the first 14 weeks consisted entirely of Zone 2 runs. I was not happy, but decided it was time to try something different.
The biggest change (and challenge) in my training was that Zone 2 initially felt like an embarrassingly slow pace.
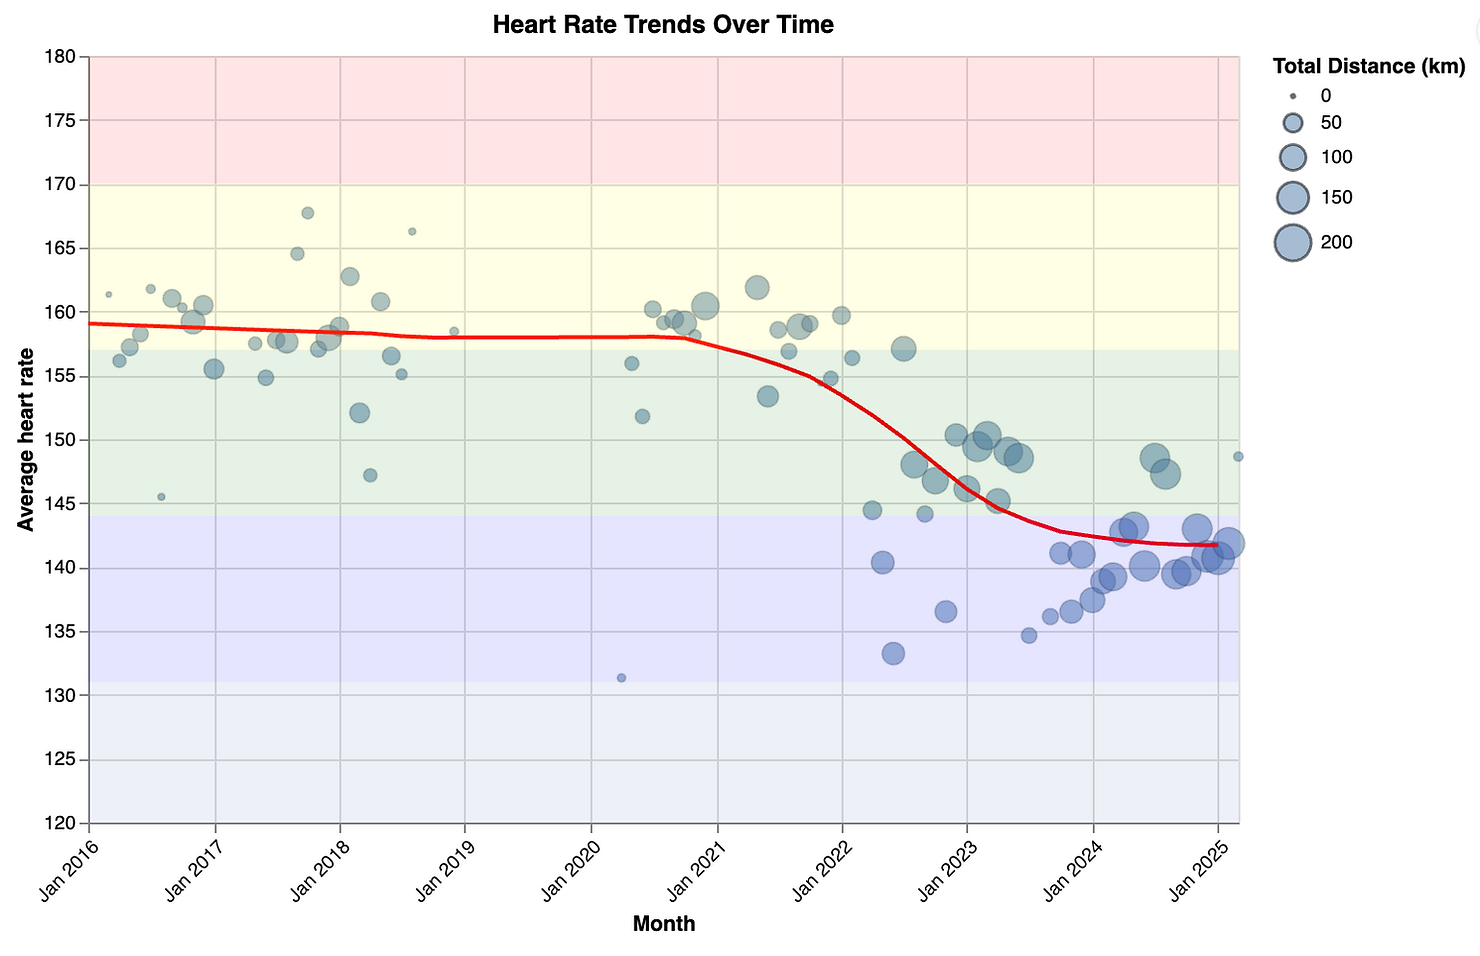
My heart rate trends graph from 2016–2025 shows a sharp drop in average HR once I started structured training. My distances per day have gotten longer as well.
Those first few months were boring as hell. For nearly 8 years, my immediate post-run reward was the adrenaline rush of pushing hard. Instead, here I was jogging at a snail’s pace. I worried I was losing fitness rather than gaining it.
Initially, my pace for my usual distances slowed down quite significantly, which was disheartening.
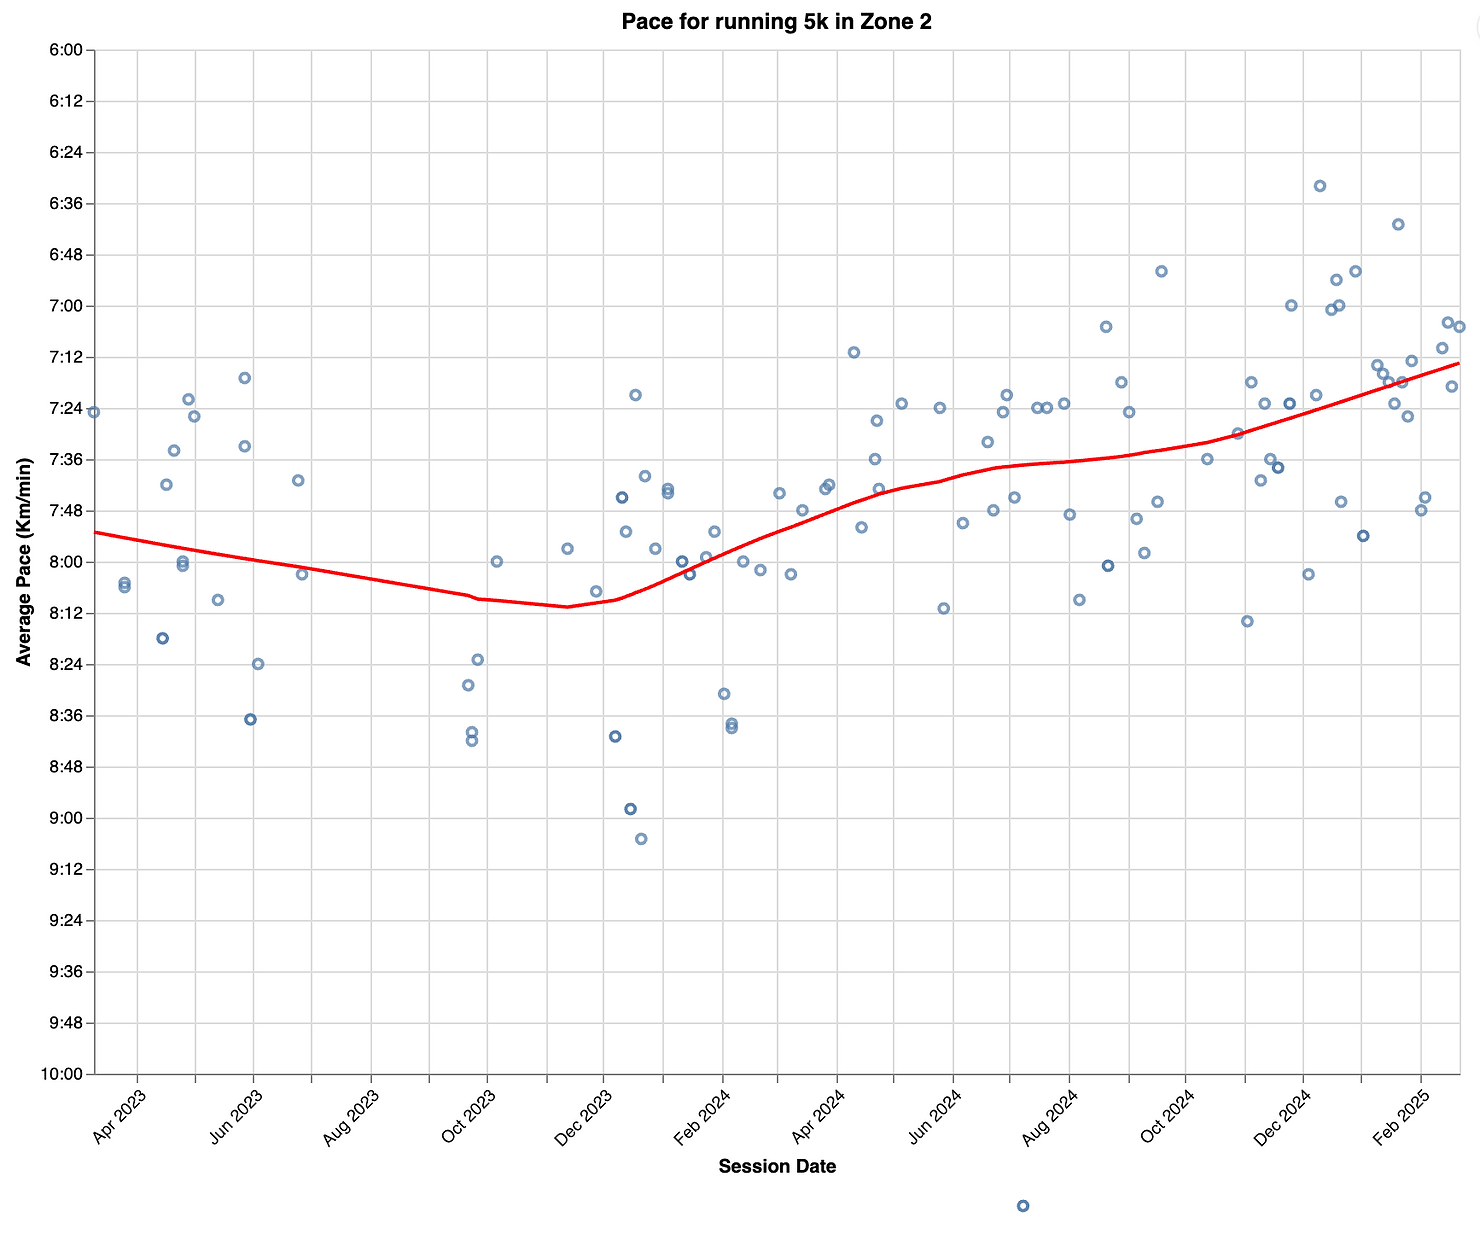
My pace for a Zone 2 5K (~140 BPM)
As you can see from the graph, my average pace for my staple distance (5K) slowed once I started this training. I could comfortably run a 5K at around 6:30/km, and now I was asked to hold 8:30–9:00/km just to stay in Zone 2! It felt like moving backward.
But I stuck with it, and around week 10, I could see something interesting happening. Although my speeds were low, distances that had previously left me winded had started becoming comfortable. My pace also started creeping up while my HR stayed the same. Even if it wasn’t providing the immediate gratification of a hard workout, maybe the science was working?
All in all, it took nearly 8 months for my pace to stop dropping, and another 4 months before it started improving beyond my previous capabilities!
Recovery Is Required to Improve the Cardiac Engine
People who do strength training know this: when you lift weights, you are not getting stronger. Instead, you are making small injuries in the muscles, and when the body repairs them, the muscles become stronger.
Similarly, cardiac improvement doesn’t happen during training – it happens during recovery. The training is there to create controlled stress on your body. Recovery periods help your body adapt and get stronger.
Before 2022, my approach left little room for proper recovery:
- My hard-ish runs every other day meant I was often starting workouts in a partially recovered state
- Running on consecutive days was very rare, since constant muscle soreness limited how frequently I could run
- I needed excessive recovery between sessions after the “moderate” Zone 3/4 efforts
- I was generally in a chronic state of partial fatigue
As a result, my body never got the recovery time it needed for proper physiological adaptations.
By implementing proper Zone 2 training (which is less taxing on the body) for most runs, I got more effective recovery between sessions and higher-quality efforts during hard workouts when I did push the intensity. This approach allowed me to train consistently without overtraining.
Intervals: Learning to Move Fast
While slow Zone 2 runs form the foundation of any training, intervals are how you get performance improvements. Unlike the “run hard every time” approach of my past, these were strategic, targeted sessions, maybe once a week.
There are several interval patterns commonly used:
- Aerobic intervals – alternating Zone 3/Zone 2 sessions to build aerobic capacity
- Zone 5 intervals (traditionally just called intervals) – short sprints to improve running form, and to teach the body to move fast and the heart to sustain that intensity
- Progressive runs (technically not intervals) – simulating how you run a race and teaching the body to handle increasing intensity
Intervals should complement Zone 2 base training, rather than detract from it.
Interval training is hard to execute without proper guidance. Traditionally, a coach would run with you to pace you correctly. However, when you are training by yourself (with a device), you need to make sure that:
- You are pushing yourself sufficiently: At different interval distances, you should be close to the maximum pace you can sustain
- You are not pushing yourself too much: The pace difference between your first few intervals and last few shouldn’t be more than 10–15 seconds
Without real-time feedback, it’s easy to push too hard or not hard enough. We originally built the Netrin app to give live feedback on interval pacing, so you could execute these complex workouts correctly. At that time, Garmin didn’t have a way to do this live training with the watch. Today you can do the entire training on Garmin, or possibly even an Apple Watch.
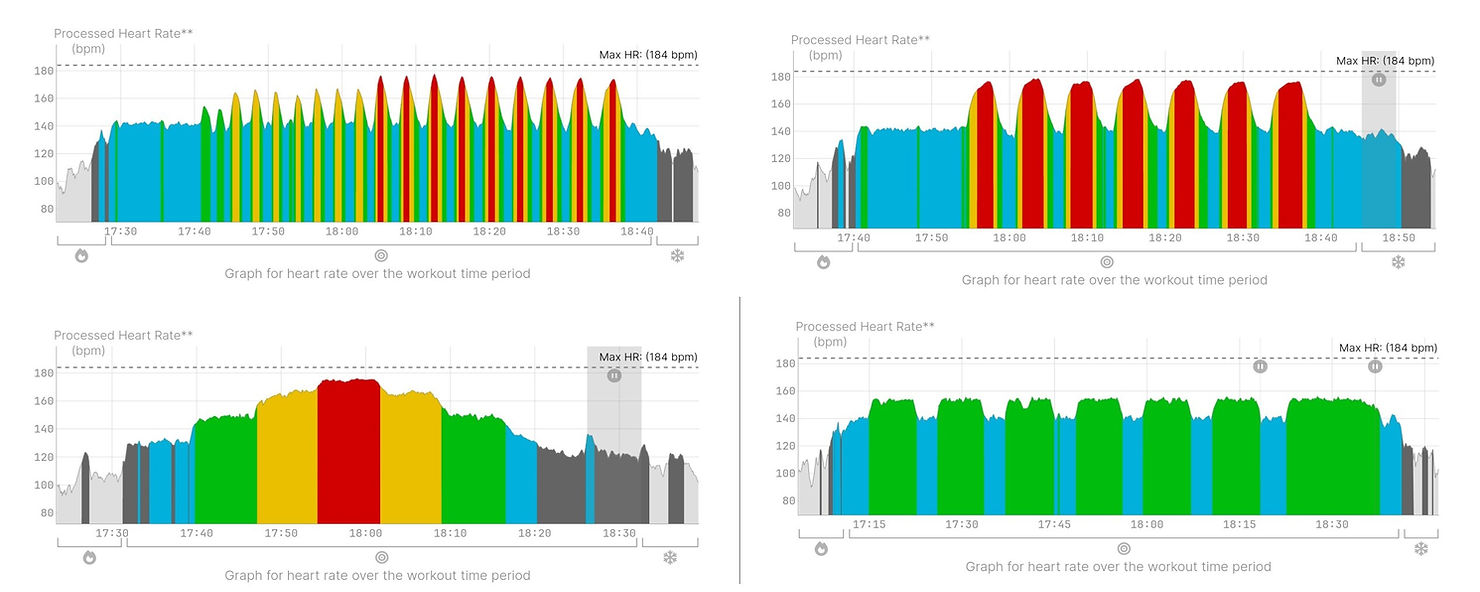
Graphs for strides (top-left), intervals (top-right), a pyramid (bottom-left) and aerobic intervals (bottom-right) are a beauty to behold.
So how do intervals help?
- They push the cardiovascular system to its limits, boosting VO2 max, which is considered the gold standard metric for cardiovascular fitness
- They teach the body to clear lactate more efficiently, and hence reduce fatigue
- They help refine running form and efficiency (when done right, intervals shouldn’t be a mad scramble; you should feel like you are gliding along the ground)
Intervals also build the mental toughness to handle controlled doses of discomfort, but I think this was less relevant to me because I was used to pushing.
Do I Need an ECG HR Monitor?
When doing zone training, the accuracy of your data matters significantly, especially when the heart rate varies quickly. Most consumer wearables use PPG (photoplethysmography) – you might have seen the green light sensors on the back of watches. Modern PPG devices are remarkably accurate during steady-state exercise but often struggle during high-intensity intervals.
At Netrin, we used ECG (electrocardiography) technology, which measures the electrical signals from your heart directly. The difference is particularly noticeable during interval training, where PPG sensors often lag or provide inaccurate readings during rapid heart rate changes. Since Netrin, I have been using a Garmin ECG-based tracker (HRM 200).
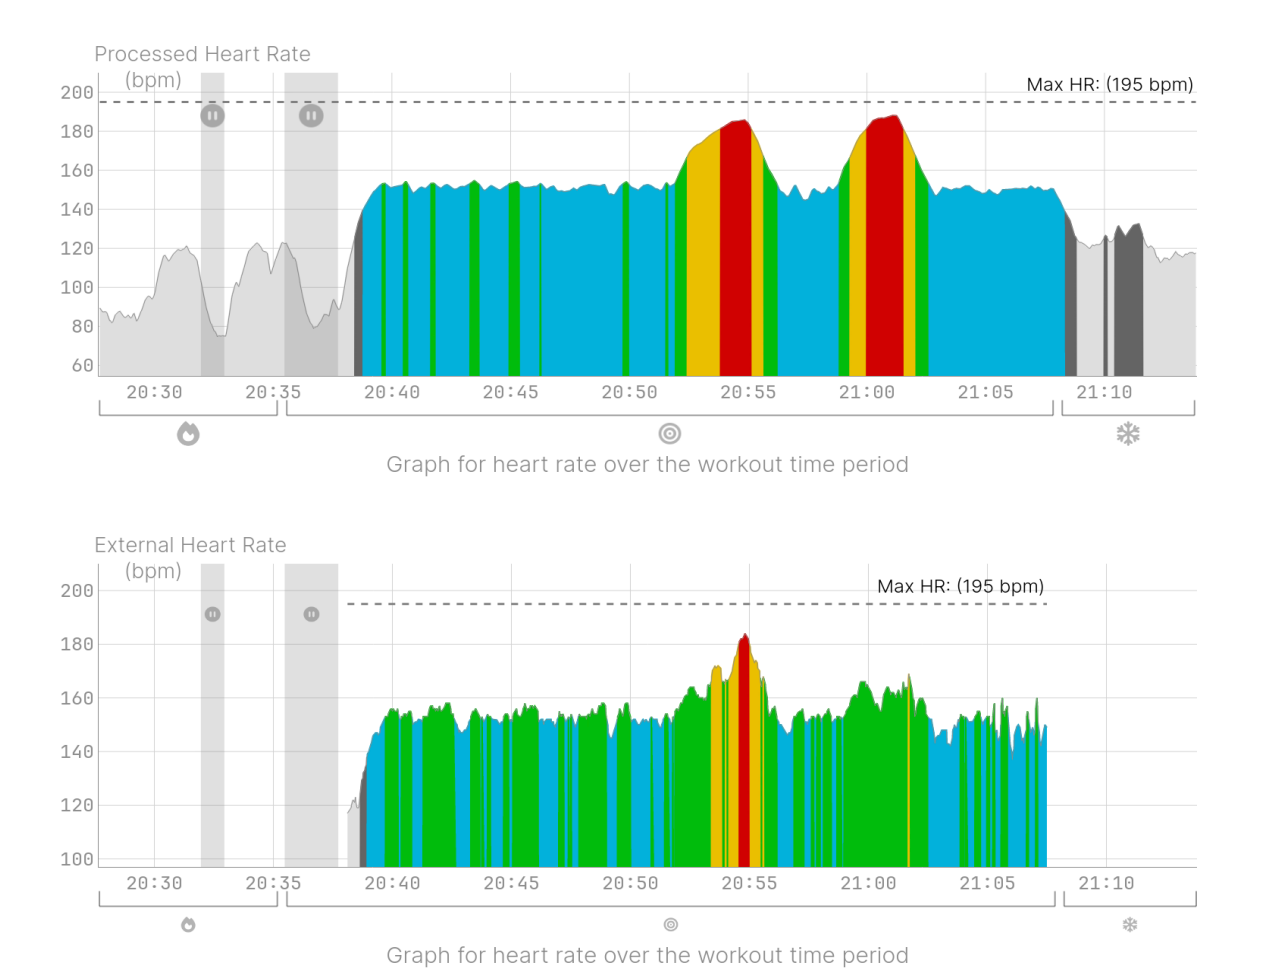
Data for the same interval session from an ECG sensor (top) and a PPG-based smartwatch (bottom) shows a lot of variation
So if you care about the HR graph looking accurate (and pretty!) in your interval runs, get an ECG tracker. In most other cases, a watch will do just fine.
Periodizing Your Workouts
Another learning for me was understanding periodization, which is the structured variation in training volume over time. Most recreational runners (including my former self) follow the same pattern week after week, leading to stagnation and accumulated fatigue.
Effective training requires variation at multiple levels, called microcycles, mesocycles and macrocycles, in addition to periodic deload weeks, where training volume temporarily decreases. A good coach implements this periodized structure, ensuring that training evolves as your fitness improves.
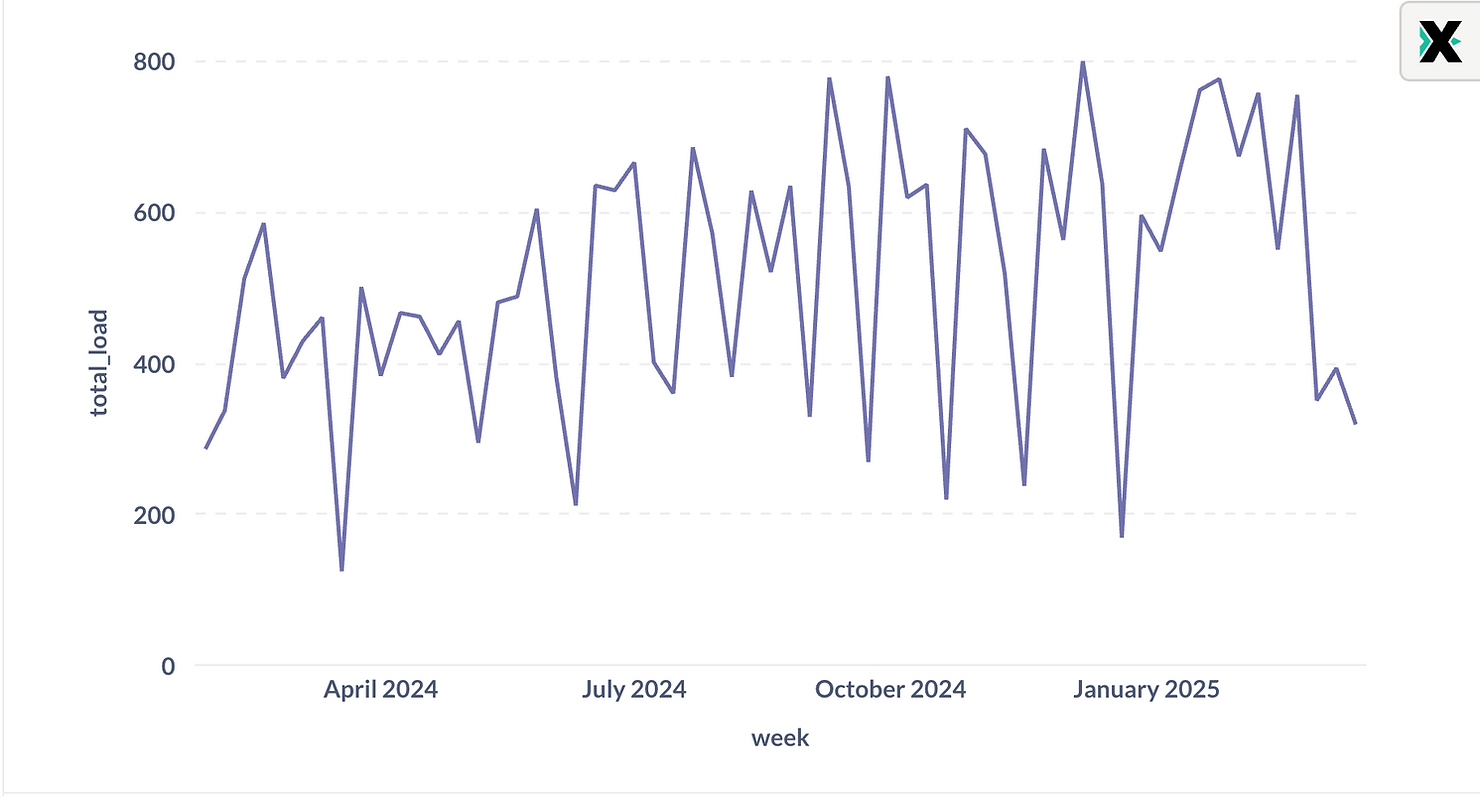
Training load over time. The sharp drops that you see once every few weeks are deload weeks.
Training for Strength
While I was primarily focusing on running, I also incorporated some strength and conditioning work. Strength training helps runners in two ways:
- It helps prevent injuries, which lets you keep running and accumulate mileage
- It builds strength, which can become the limiting factor once you have developed some cardiac endurance
When you are starting out, you don’t need to go to a gym! Bodyweight exercises are a good place to start for most runners. Even 15–20 minutes of strength/mobility work a few times a week can make a significant difference over time.
That said, you will eventually outgrow bodyweight training. After about two years of consistent bodyweight routines, I reached a point where I needed more resistance to continue making strength gains. At that stage, I found a qualified personal trainer who could ensure proper form with weighted exercises. Later still, I joined a group callisthenics gym, which has been helpful (and fun!).
Coming Next: The Transformation Results
In the next post, I’ll share the detailed results of this science-based approach, with the numbers behind my breakthrough, from pace improvements to race performances.
Comments